
How does Ferrari make money?
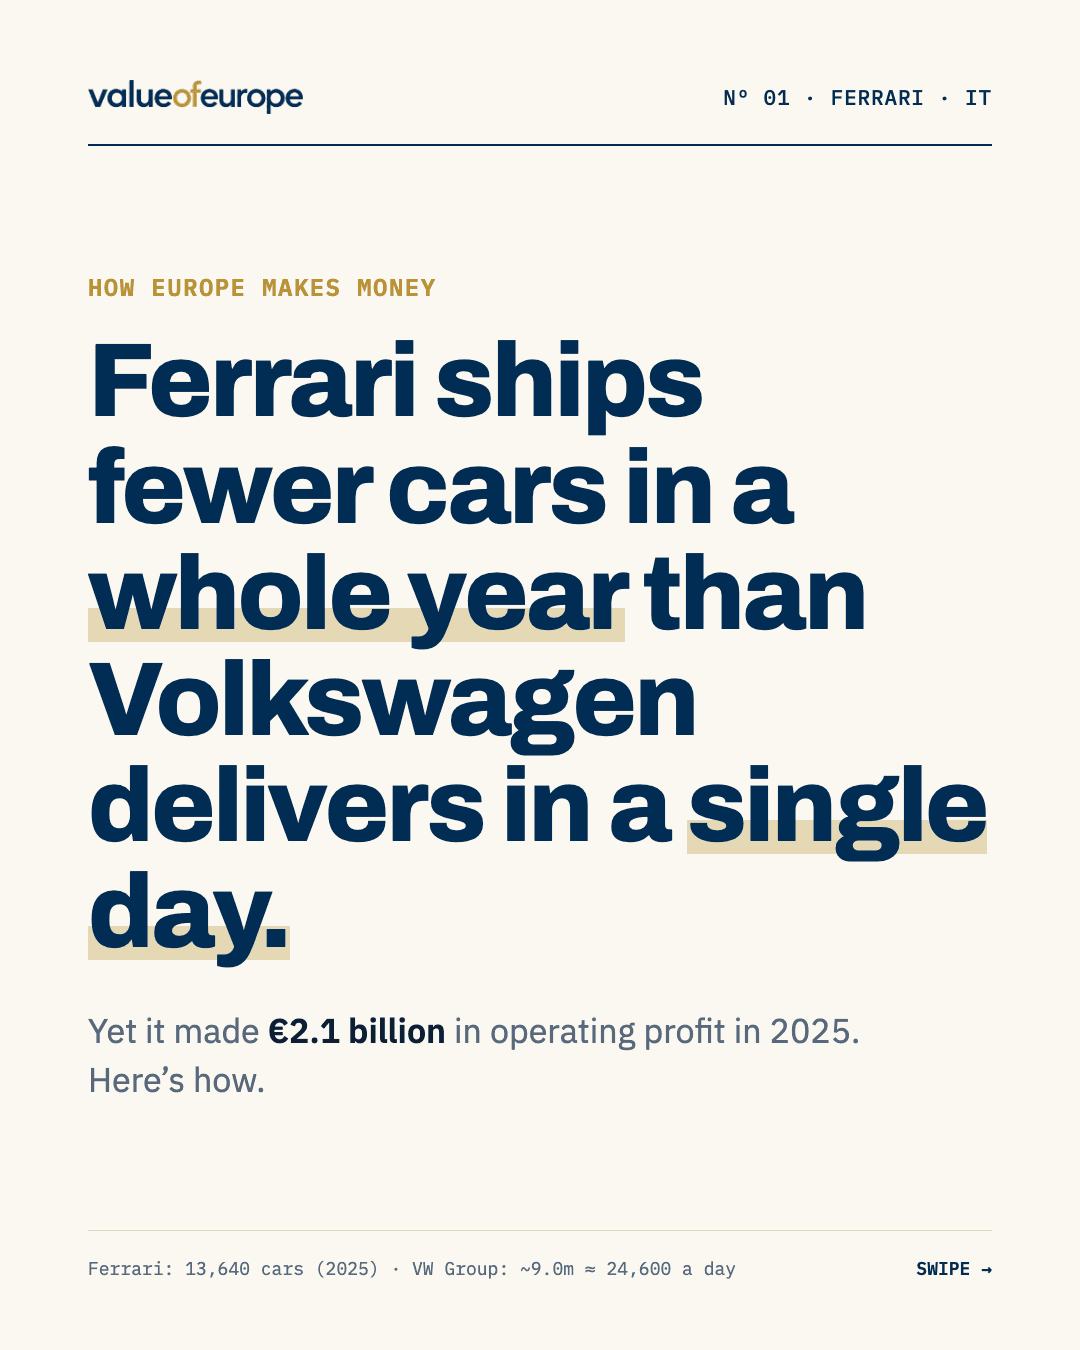
Ferrari ships fewer cars in a whole year than Volkswagen delivers in a single day.
Yet it made €2.1 billion in operating profit in 2025. Here’s how.
Figures · Financial year 2025
Quick answers
- How does Ferrari make money?
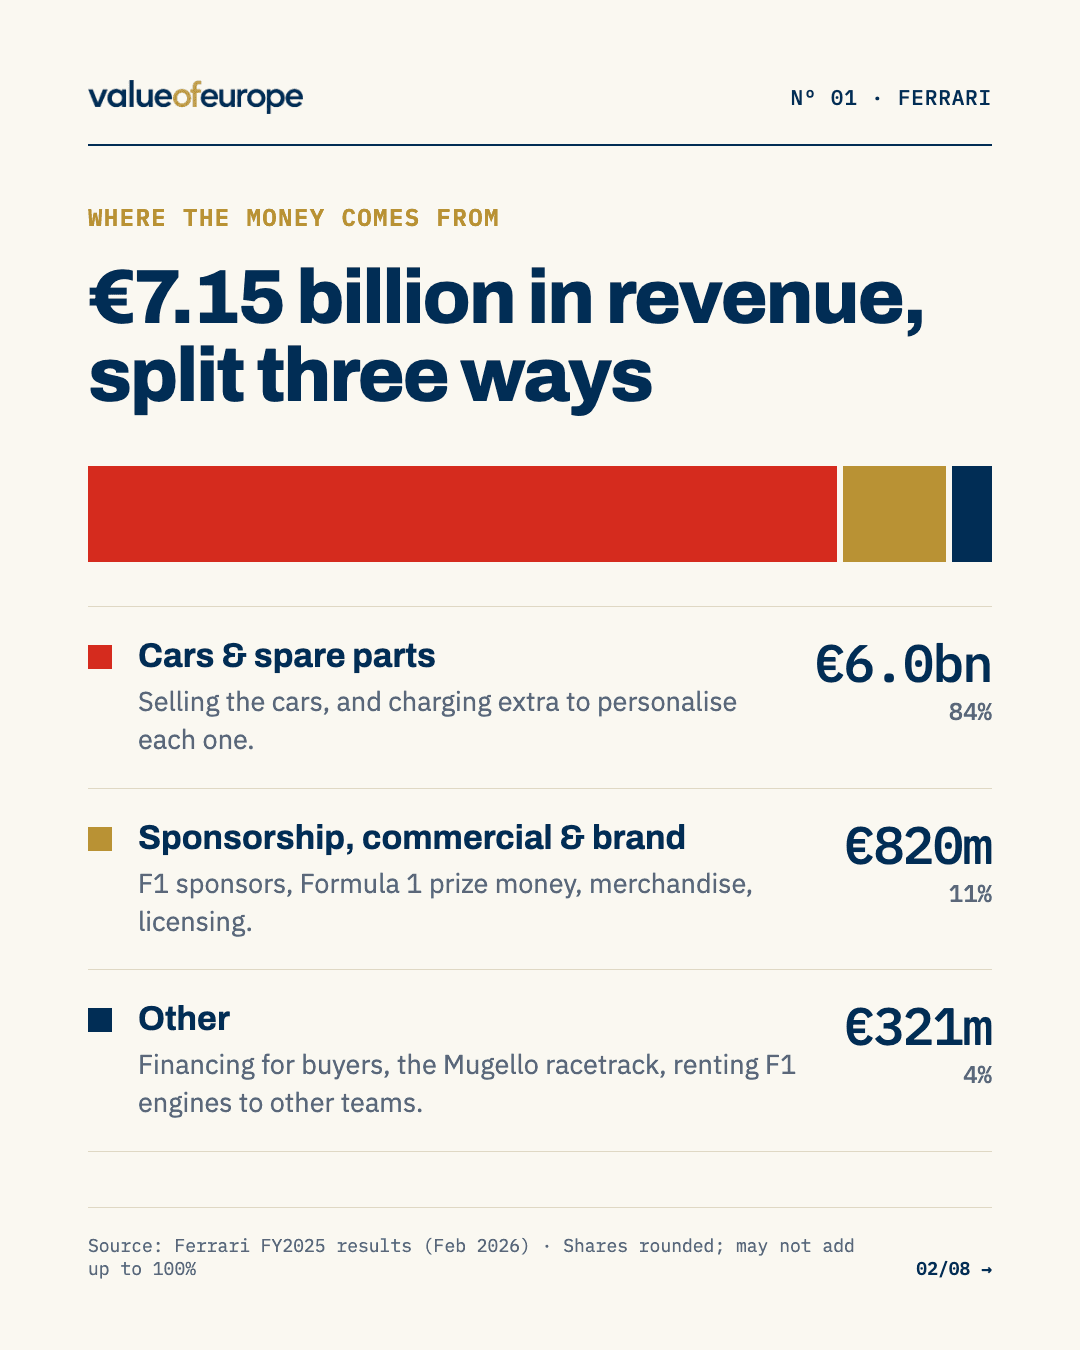
- €7.15 billion in revenue, split three ways: Cars & spare parts €6.0bn (84%); Sponsorship, commercial & brand €820m (11%); Other €321m (4%).
- What makes Ferrari hard to copy?
- Scarcity by design, racing is the marketing and pricing power.
- What are the main risks for Ferrari?
- From its own reports: going electric, tariffs & currencies, results on the track and stretching the brand.
It doesn’t sell cars. It sells scarcity.
Data & context
Ferrari: the full breakdown
02
Where the money comes from
€7.15 billion in revenue, split three ways
| Segment | Value | Share |
|---|---|---|
| Cars & spare partsSelling the cars, and charging extra to personalise each one. | €6.0bn | 84% |
| Sponsorship, commercial & brandF1 sponsors, Formula 1 prize money, merchandise, licensing. | €820m | 11% |
| OtherFinancing for buyers, the Mugello racetrack, renting F1 engines to other teams. | €321m | 4% |
Source: Ferrari FY2025 results (Feb 2026) · Shares rounded; may not add up to 100%4 figures traced to source ↓
03
2025 in four numbers
Fewer cars. More money.
- Cars shipped
- 13,640
- –1% vs 2024, on purpose
- Revenue
- €7.15bn
- +7% vs 2024
- Operating margin
- 29.5%
- VW Group: 2.8%
- Industrial FCF
- €1.54bn
- +50% vs 2024
Sources: Ferrari FY2025 · Volkswagen Group FY2025 results5 figures traced to source ↓
04
The strategy
Sell one car less than the market wants
Ferrari caps production on purpose. In 2025 demand stayed strong, yet shipments were kept flat. Its order book already reaches towards the end of 2027.
Source: Ferrari FY2025 results2 figures traced to source ↓
05
The moat
Why nobody can just copy it
- 01
Scarcity by design
An order book stretching towards the end of 2027. Most carmakers chase volume; Ferrari rations it.
- 02
Racing is the marketing
The only team in every Formula 1 season since 1950. Sponsors pay Ferrari to be seen with it.
- 03
Pricing power
Clients pay extra for personalisation. Richer models and options grew revenue while volumes stayed flat.
Source: Ferrari FY2025 results1 figure traced to source ↓
06
The risks
What could go wrong
- 01
Going electric
The Ferrari Luce is its first fully electric car. Will buyers still want a Ferrari without the engine sound?
- 02
Tariffs & currencies
US tariffs on EU cars and a weaker dollar and yen already weighed on 2025.
- 03
Results on the track
Part of its Formula 1 income depends on where the team finishes.
- 04
Stretching the brand
Fashion and merchandise grow revenue, but too much could cheapen the badge.
Source: Ferrari FY2025 results2 figures traced to source ↓
07
The surprising part
Operating profit per car sold
Every Ferrari earns the company roughly what 150 Volkswagen Group vehicles do.
Group operating profit ÷ vehicles, 2025. Ferrari: €2.11bn ÷ 13,640. VW Group: €8.9bn ÷ ~9.0m. Simplified: both include non-car income.3 figures traced to source ↓
Fact check
Where every number comes from
All 20 figures and claims on the slides, each with its value in the source, the page it’s on and a link to the document. Calculated figures show their formula, so you can redo the maths.
Slide 01Ferrari ships fewer cars in a whole year than Volkswagen delivers in a single day.
Ferrari shipped 13,640 cars in 2025
Reported13,640 units
[1] Ferrari FY2025 results press release · p.1 table: Shipments
VW Group ~9.0m vehicles ≈ 24,600 a day
Calculated24,658 units/day
[2] Volkswagen Group Annual Report 2025 – summary · Deliveries ÷ 365 (VW Annual Report 2025)
€2.1 billion operating profit
Reported€2,110m
[1] Ferrari FY2025 results press release · p.1 table: Operating profit (EBIT)
Slide 02Where the money comes from
Revenue €7.15 billion
Reported€7,146m
[1] Ferrari FY2025 results press release · p.1 table: Net revenues
Cars & spare parts €6.0bn (84%)
Calculated84.0%
[1] Ferrari FY2025 results press release · p.3 revenue table: 6,005
Sponsorship, commercial & brand €820m (11%)
Calculated11.5%
[1] Ferrari FY2025 results press release · p.3 revenue table: 820
Other €321m (4%)
Calculated4.5%
[1] Ferrari FY2025 results press release · p.3 revenue table: 321
Slide 032025 in four numbers
Cars shipped –1% vs 2024 (13,752 in 2024)
Reported13,752 units (2024)
[1] Ferrari FY2025 results press release · p.1 table
Revenue +7% vs 2024
Reported7.0%
[1] Ferrari FY2025 results press release · p.1 table
Operating margin 29.5%
Reported29.5%
[1] Ferrari FY2025 results press release · p.1 table: EBIT margin
VW Group operating margin 2.8%
Reported2.8%
[2] Volkswagen Group Annual Report 2025 – summary · VW AR 2025 summary: “operating return on sales of 2.8%” (= operating result ÷ sales revenue, i.e. operating margin)
Industrial free cash flow €1.54bn, +50%
Reported€1,538m
[1] Ferrari FY2025 results press release · p.1 table
Slide 04The strategy
Order book towards the end of 2027
Wording
[1] Ferrari FY2025 results press release · CEO quote, p.1
“Always deliver one car less than the market demands” – attributed to Enzo Ferrari
Wording
[3] Ferrari Boss Claims Maranello Will Always Deliver 'One Car Less Than Market Demand' (secondary: press article) · Ferrari CMO Enrico Galliera quoting Enzo Ferrari: “Ferrari will always deliver one car less than the market demand.” (secondary source; Ferrari CMD 2022 article also paraphrases it)
Slide 05The moat
Only team in every F1 season since 1950
Wording
[4] Formula 1 official team page: Ferrari · Team page intro: “The only team to have competed in every season since the world championship began”
Slide 06The risks
Ferrari Luce is first fully electric car
Reported
[1] Ferrari FY2025 results press release · Subsequent events, p.5
US tariffs and currency swings weighed on 2025
Wording
[1] Ferrari FY2025 results press release · Business dynamics, p.2–3
Slide 07The surprising part
Operating profit per car ≈ €155,000 (Ferrari)
Calculated€154,692
[1] Ferrari FY2025 results press release · EBIT ÷ shipments
Operating profit per vehicle ≈ €1,000 (VW Group)
Calculated€989
[2] Volkswagen Group Annual Report 2025 – summary · Op. result ÷ deliveries (VW Annual Report 2025)
≈ 150 VW Group vehicles
Calculated156.4×
Ferrari ÷ VW per-vehicle profit
Source documents
- [1]Ferrari FY2025 results press release ↗
Ferrari N.V. · 10 Feb 2026
- [2]Volkswagen Group Annual Report 2025 – summary ↗
Volkswagen AG · Mar 2026
- [3]
- [4]Formula 1 official team page: Ferrari ↗
Formula One (formula1.com) · accessed 7 Oct 2026
For education only. Nothing on this site is investment advice or a recommendation to buy, sell or hold any security. Figures come from official company reports, filings and regulator documents plus our own calculations; sources are named on each breakdown. At the time of publication we hold no individual shares in the companies we cover; broad index funds (ETFs) may hold them indirectly.