
How does ASML make money?
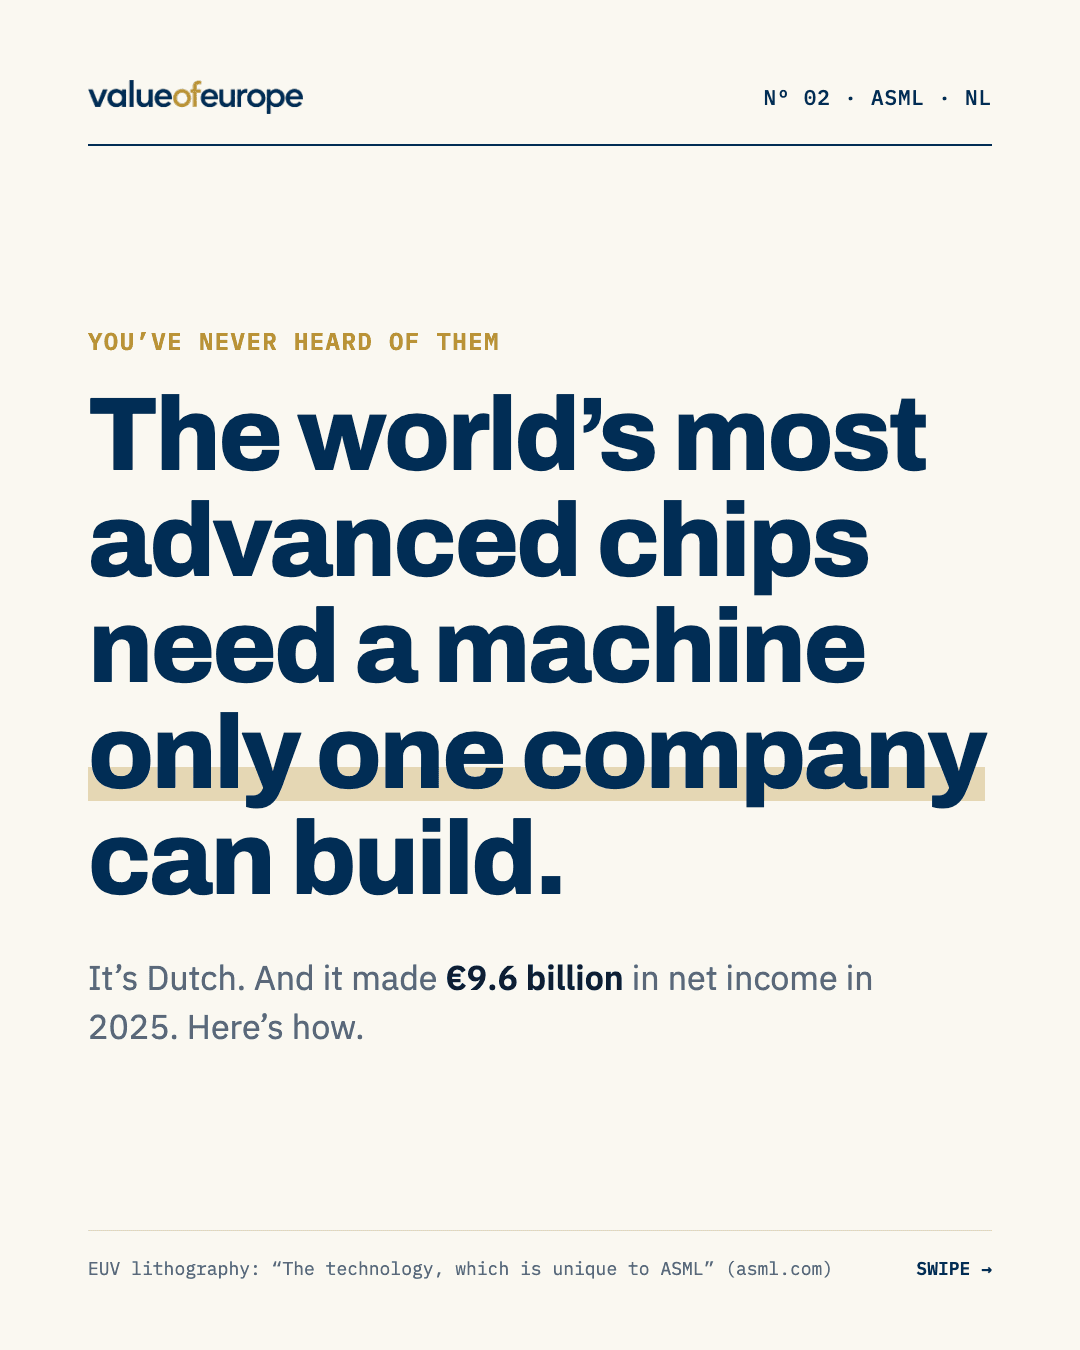
The world’s most advanced chips need a machine only one company can build.
It’s Dutch. And it made €9.6 billion in net income in 2025. Here’s how.
Figures · Financial year 2025
Quick answers
- How does ASML make money?
- €32.7 billion in revenue, from two sources: Machines €24.5bn (75%); Service & upgrades €8.2bn (25%).
- What makes ASML hard to copy?
- Decades of R&D, every sale keeps paying and the next generation is already shipping.
- What are the main risks for ASML?
- From its own reports: geopolitics, a small club of customers, chip cycles and riding the AI wave.
It doesn’t make chips. It makes chipmaking possible.
Data & context
ASML: the full breakdown
02
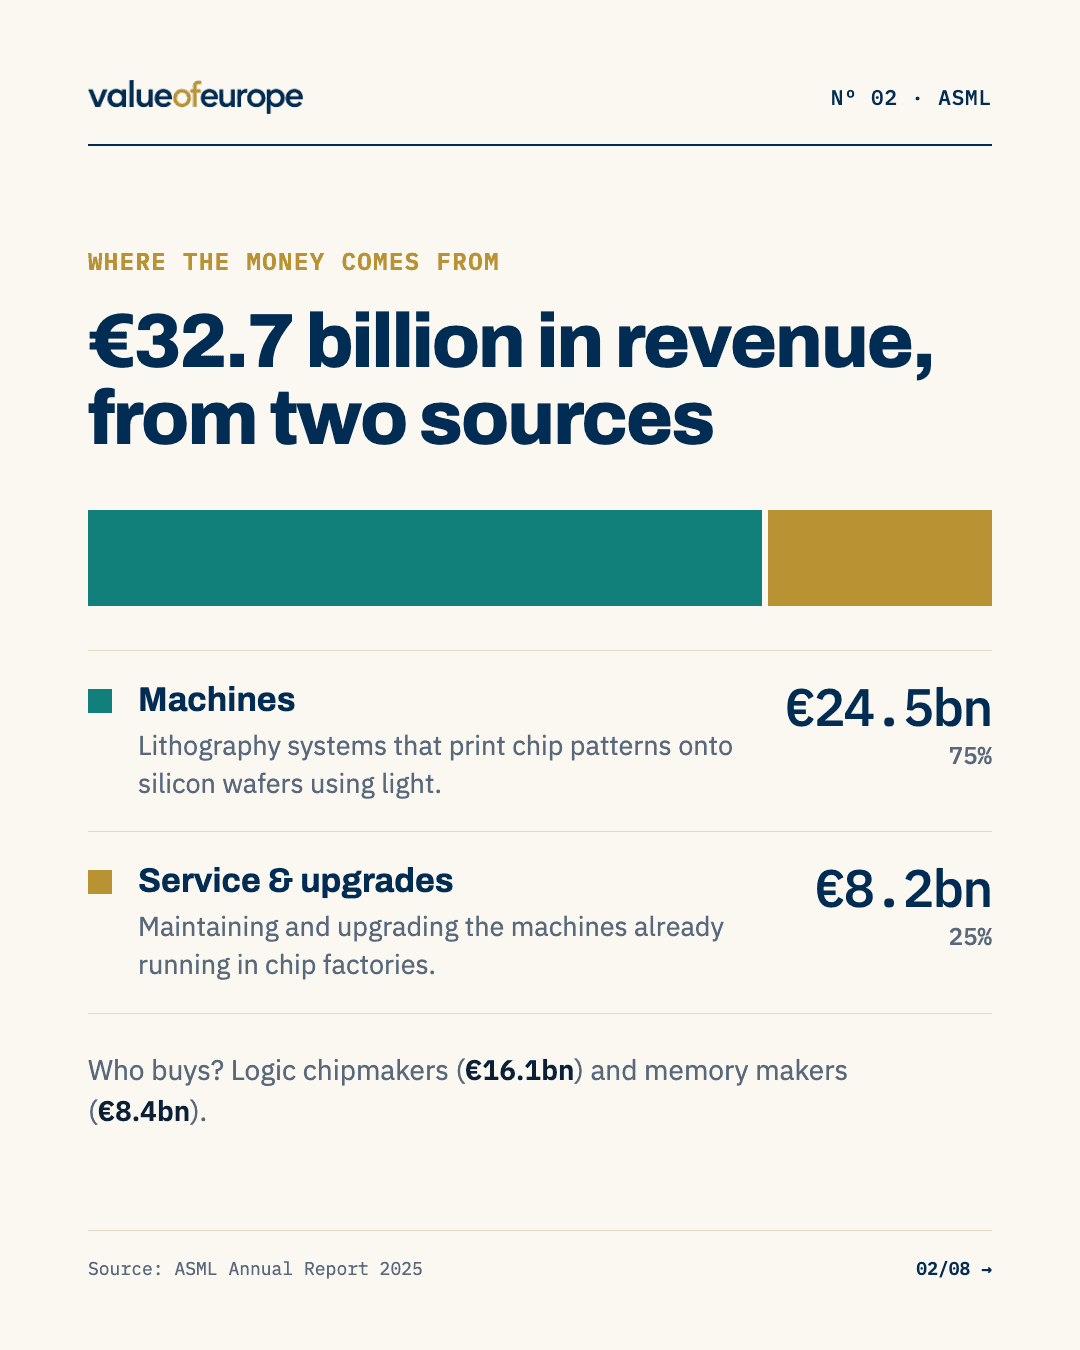
Where the money comes from
€32.7 billion in revenue, from two sources
| Segment | Value | Share |
|---|---|---|
| MachinesLithography systems that print chip patterns onto silicon wafers using light. | €24.5bn | 75% |
| Service & upgradesMaintaining and upgrading the machines already running in chip factories. | €8.2bn | 25% |
Who buys? Logic chipmakers (€16.1bn) and memory makers (€8.4bn).
Source: ASML Annual Report 20254 figures traced to source ↓
03
2025 in four numbers
Fewer machines. Bigger tickets.
- Systems sold
- 327
- 418 in 2024 · 48 of them EUV
- Revenue
- €32.7bn
- +15.6% vs 2024
- Gross margin
- 52.8%
- 51.3% in 2024
- Order backlog
- €38.8bn
- Ordered, not yet delivered
Sources: ASML Annual Report 2025 · ASML Q4 2025 results5 figures traced to source ↓
04
The strategy
Be the only one who can do it
EUV machines print chip patterns with light of just 13.5 nanometres. Chipmakers use them for the most complex layers of their most advanced chips.
Sources: asml.com · ASML Annual Report 20252 figures traced to source ↓
05
The moat
Why nobody can just copy it
- 01
Decades of R&D
€4.7 billion spent on research and development in 2025 alone. Catching up would take years and billions.
- 02
Every sale keeps paying
Installed machines need service and upgrades for years. That business grew 26% to €8.2bn in 2025.
- 03
The next generation is already shipping
Its newest High-NA EUV systems (EXE): four were recognised in sales in 2025, up from two.
Source: ASML Annual Report 20253 figures traced to source ↓
06
The risks
What could go wrong
- 01
Geopolitics
Which machines it may sell to China depends on government export rules, not just on demand.
- 02
A small club of customers
Only a few chipmakers build leading-edge chips, so each one’s plans matter a lot.
- 03
Chip cycles
Chip demand swings. Sales to memory makers already dipped in 2025, from €8.6bn to €8.4bn.
- 04
Riding the AI wave
Much of today’s growth comes from AI investment. If that spending slows, orders could too.
Source: ASML Annual Report 20251 figure traced to source ↓
07
The surprising part
ASML spends about €13 million a day on R&D
Its research budget alone is more than twice what Ferrari earned in operating profit in 2025.
2025 figures. ASML R&D: €4,698.8m ÷ 365 ≈ €12.9m/day. Ferrari: €2,110m operating profit (see Nº 01).2 figures traced to source ↓
Fact check
Where every number comes from
All 19 figures and claims on the slides, each with its value in the source, the page it’s on and a link to the document. Calculated figures show their formula, so you can redo the maths.
Slide 01The world’s most advanced chips need a machine only one company can build.
EUV technology “unique to ASML”
Wording
[1] ASML website – EUV lithography systems · EUV page text
Net income €9.6 billion
Reported€9,609m
[2] ASML Annual Report 2025 – financial performance section · p.53 operating results table
Slide 02Where the money comes from
Total revenue €32.7bn
Reported€32,667m
New machines €24.5bn (75%)
Calculated74.9%
[2] ASML Annual Report 2025 – financial performance section · p.53: 24,474.3
Service & upgrades €8.2bn (25%)
Calculated25.1%
[2] ASML Annual Report 2025 – financial performance section · p.53: 8,193.0
Logic €16.1bn · memory €8.4bn
Reported€16.1bn(logic)
[2] ASML Annual Report 2025 – financial performance section · p.53 net sales growth chart
Slide 032025 in four numbers
327 systems sold (418 in 2024)
Reported327 units
48 EUV systems (44 NXE + 4 EXE)
Reported48 units
Revenue +15.6%
Reported15.6%
Gross margin 52.8% (51.3% in 2024)
Reported52.8%
Order backlog €38.8bn
Reported€38,797m
[3] ASML Q4/FY2025 results press release (SEC Form 6-K) · Backlog end-2025
Slide 04The strategy
EUV light of 13.5 nanometres
Reported13.5 nm
[1] ASML website – EUV lithography systems · EUV page
Logic sales rose from €13.2bn to €16.1bn
Reported€13.2bn(2024)
Slide 05The moat
R&D €4.7bn in 2025
Reported€4,699m
Service grew 26% to €8.2bn
Reported26.2%
4 High-NA (EXE) systems in 2025, up from 2
Reported4 units
Slide 06The risks
Memory sales dipped from €8.6bn to €8.4bn
Reported€8.4bn
Slide 07The surprising part
≈ €13 million a day on R&D
Calculated€12.9 m/day
More than twice Ferrari's operating profit
Calculated2.2×
[2] ASML Annual Report 2025 – financial performance section · R&D ÷ Ferrari EBIT
Source documents
- [1]ASML website – EUV lithography systems ↗
ASML Holding N.V. · accessed 6 Oct 2026
- [2]ASML Annual Report 2025 – financial performance section ↗
ASML Holding N.V. · 2026
- [3]ASML Q4/FY2025 results press release (SEC Form 6-K) ↗
ASML Holding N.V. · 28 Jan 2026
For education only. Nothing on this site is investment advice or a recommendation to buy, sell or hold any security. Figures come from official company reports, filings and regulator documents plus our own calculations; sources are named on each breakdown. At the time of publication we hold no individual shares in the companies we cover; broad index funds (ETFs) may hold them indirectly.